
‘Bout time I revisited Saga Furs (SAGCV:FH). Loyal readers will hopefully recall my original investment write-up, two years ago now:
And boy, that’s what it’s proved to be ever since… Wisely, I wrapped up my last post with a potential health warning for readers (& included a scary looking chart). At first, it seemed unnecessary, as Saga managed to rally 20%+ in the following two months (hitting almost EUR 50.00 a share, which was gratifying). I must admit, I certainly didn’t expect what came next…
Now, I should encourage you, please go back & read my original post – it provides useful background on the fur industry & Saga Furs, which I don’t plan on revisiting here. [And I’m ignoring an anti-fur movement that’s become increasingly irrelevant…but I should clearly highlight Saga isn’t a stock for everyone, though obviously it’s not a fur producer itself]. Let’s recap my positive investment thesis at the time:
- Triple Threat: Saga Furs offers attractive exposure to three of my favourite things: Emerging Markets, Luxury Goods & Auction Houses.
- Supply: European/N American fur production is highly regulated (& superior to Chinese fur), with supply constrained despite generally increasing prices.
- Demand: High-growth/secular fur market trend in the past decade or so, driven by Western fashion/luxury revival & new emerging market demand.
- Resilience: Despite a 39% post-crisis collapse in sales, Saga’s P&L stayed close to break-even. [Aided by inversely-correlated commission rates, which increase as sales decline]. Auction sales rebounded 78% the following year.
- Investment: Significant percentage of Saga’s annual turnover is ploughed into expanding capacity, European/global fur lobbying, and the promotion of Saga Furs as a luxury brand.
- Market Share/Network Effect: Now permanent agreement with American Legend & Fur Harvesters Auction to sell via Saga auction, thereby creating some of the largest fur auctions in the world & significantly improving Saga’s effective market share.
- Valuation: Stock cheap in absolute terms, vs. long term earnings growth & an average adjusted operating FCF margin of 28.0%. Also cheap in relative terms, vs. auction house & luxury goods sectors.
Unfortunately, the perfect storm was ready to hit: Dec-2013 auction sales collapsed 76%, as prices & the number of pelts sold dropped precipitously. Despite the about-face, initially this seemed like a bit of a buyers’ strike really…brought on by a mild winter, sticker shock (after pelt prices doubled in 3 years), higher retail inventories, and signs of slowing Russian & Chinese growth. Looking back, we know better now. It did prove to be a temporary buyers’ strike (as I’ll highlight below), but clearly the December auction heralded a more serious & sustained market disruption – the Chinese crackdown on luxury gifts was just gathering momentum at the time, and Putin was on the verge of sending the Russian economy (& ruble) over a cliff by backing military intervention in Ukraine.
The addition of American Legend & Fur Harvesters Auction to Saga’s Mar-2014 auction did attract buyers & kick-start sales again. Unfortunately, only in terms of pelts sold…fox pelts fell 23% & mink prices actually fell 50% yoy. The June auction saw more of the same, with some stabilisation & improvement finally visible at the September auction (noting it’s the least important sale annually). Saga’s difficulties were compounded by some (manageable) credit losses on receivables, a significant loss on breeding animals (a business it is actually involved in) for which demand fell sharply, and a weaker dollar. [NB: Auctions are dollar-denominated, while Saga’s costs are predominantly in euro. Sustained EUR/$ depreciation only began in summer 2014].
By end FY-2014, the damage was done – a 56% & 36% decline in mink & fox pelt prices, respectively, delivered a 43% decline in auction sales & a 29% fall in net turnover. [In comparison, the post-crisis sales decline occurred over a 3 year period]. Quite extraordinarily, Saga still managed to eke out a profit. The fact the number of pelts sold actually increased 7% yoy, and that Saga tripled its net capex (albeit, inc. a property purchase), was also notable…both appeared to be healthy medium term indicators.
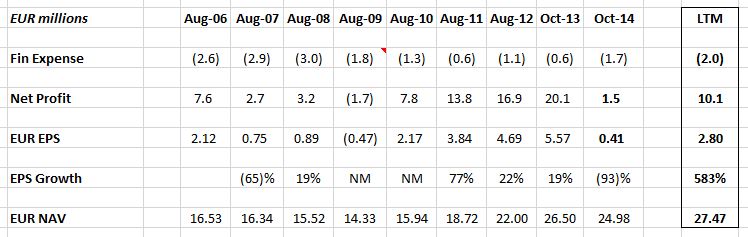
But why don’t we skip ahead & let the numbers tell their own story. Here’s a condensed version of my original financial table, now including FY-2013, FY-2014 & Last Twelve Months (LTM, ending Jul-2015) figures:

As you can see, the real story is the subsequent rebound in sales…
Prices finally started perking up a little last September, followed by a December auction which delivered a 47% jump in sales – mostly due to an increase in pelts sold. The momentum was maintained with March sales this year up 30%, while June sales rose 40%, both results driven primarily by higher prices. Of course, the dollar rally over the past year or so obviously made a valuable contribution too, really helping to turbo-charge Saga’s top & bottom line. Maybe it’s a good idea to include another table here, showing the actual trajectory of the recovery – with Saga’s results being so seasonal, it’s probably better to track the evolution of its LTM figures since Jul-2014:

[NB: FY-2015 results haven’t been released yet, but if we reference LTM sales of EUR 636 million & the latest turnover/sales ratio (of 9.0%), we can pretty reliably estimate FY-2015 turnover of EUR 57.4 million.]
[Of course, all news can’t be good news, we saw a bit of a reversal at the most recent auction…though September’s the least important (& lowest quality) auction of the year, so it’s not the most reliable leading indicator. The Russian & Chinese economies are cited as the usual suspects, but that ain’t exactly new or unexpected at this point!? More notable was a new (end-June) 10-15% tax on pelts imported to China for dressing…which does need to be monitored for any longer-lasting impact. But the industry’s already enjoyed significant wage savings globally from a migration of pelt dressing to HK/China, so this tax is really just an offsetting cost to bear.]
Saga’s adjusted operating profit margin has actually tripled vs. the 7.6% margin we saw in FY-2014. [NB: Adjusted operating profit includes financial income earned on producer & buyer receivables. As I’ve argued before, this income should be considered an integral part of the company’s business model/operating profit]. Which now pegs LTM EPS at EUR 2.80 per share – a whopping seven times FY-2014 EPS! Considering the scale of this earnings growth/recovery we’re seeing, does a 6.4 P/E not strike you as ridiculous..?!
‘Course this is where the naysayers jump in: Saga’s a volatile, unpredictable & cyclical company, it simply doesn’t deserve (& will never deserve) a high multiple…in fact, a low multiple might well be a sell signal!? Yeah, but that’s rubbish – those same people would have laughed in your face, if you dared suggest Saga would almost quadruple auction sales (from a post-crisis low) in just four years.
But that’s exactly what happened..!
As far as I’m concerned, the fur market’s clearly enjoying well above average secular growth, driven by a fashion revival & new emerging market demand. [And considering the small size of the market, which is colliding with new global demand (& wealth), I suspect Russia & China’s current economic/political issues will prove mere hiccups longer term…] The figures certainly appear to back me up: Like many sectors, the fur industry may be cyclical, but successive auction sales peaks & troughs have (each) more than doubled, and will hopefully continue to escalate both in terms of volume & value. The consistent increase in the number of pelts sold over the past couple of years, regardless of auction sales & price volatility, is also particularly encouraging. Of course, we shouldn’t forget Saga’s business model (matching up producers & trade buyers) is always going to be inherently more volatile than a typical luxury goods company’s wholesale, retail & outlet distribution chain. I may not have stressed that enough originally…I have to admit, I was more focused on the resilience of the business model itself.
[And speaking of resilience…if you’re at all concerned about the (unlikely) prospect of the hammer somehow dropping on the entire European fur industry, Saga’s now trading at a 35% discount to its current (& very tangible) EUR 27.47 NAV. Knowing the EU’s love of phasing out & compensation payments, I’m confident shareholders would recover NAV (at the very least) in a worst case scenario.]
Fair enough, but haven’t I been banging on about focusing more on large-cap developed market stocks recently? Surely Saga Furs is the exact opposite – a small-cap stock that’s ever more dependent on the fortunes of emerging markets like China, Russia, etc.?! True, but don’t presume a portfolio marches in one direction only – because, as investors, we can never be quite sure of when & where we’ll arrive… I believe Saga presents a unique story & investment opportunity – and it’s a Western stock which offers access to emerging/frontier market growth, an investment theme I also recommended.
In reality, the entire luxury goods sector (& its investors) are also grappling with the same emerging market head-winds near term, vs. the obvious long term opportunity these markets also present. [NB: I previously highlighted Saga boasts similar/superior long term margins & earnings growth, but was trading at a radical discount to the luxury goods (& auction house) sectors]. I’m biased towards a positive long term perspective myself, but I agree the sector may remain a challenging bet for some time to come. Unfortunately, the best long term investment opportunities are sometimes the most difficult to buy…but Saga Furs is again a much cheaper (& maybe safer) way to make that bet.
So, what kind of valuation does Saga deserve now? OK, let’s focus on its recent figures in more detail, together with some 2006-14 averages:


Noting the scale of the recovery in the past year, we could probably argue for just about any P/E ratio we like, so it’s probably sensible if we put that aside & simply focus on a Price/Sales valuation here. Looking back, I previously noted (for FYs 2006-2012) an average adjusted operating margin of 24.2% & an average adjusted operating free cash flow margin of 28.0%. Updating these averages (to inc. FY-2013/2014), Saga’s average adjusted operating margin now stands at 26.5%. However, its average adjusted Op FCF margin is only 9.7%…but is obviously distorted by a massive (working capital) outflow in FY-2014.
[At first glance, for a lot of investors, Saga Furs unfortunately looks like a company with poor cash flow & massive leverage. For example, at end FY-2014, there was EUR 166 million of (mostly) interest bearing receivables outstanding. That’s well over 3 years of turnover, and even worse it’s funded by almost EUR 100 million of debt (compared to EUR 90 million of equity)!?! But this is a totally misleading picture…
Receivables should actually be judged in relation to total auction sales (of EUR 505 million), not turnover. And the increase in receivables is another counter-cyclical element of Saga’s business model – a tougher period for the industry will naturally require greater producer financing & longer payment terms, on which it earns hefty interest income & fees. And the credit exposure (& debt required to finance it) poses a lot less risk than might be initially perceived – Saga holds title, receivables still get paid down pretty quickly (as seen above), credit losses have been limited over the years (and are far exceeded by the related finance income), and a substantial portion of those losses were subsequently recovered. Let’s not forget, it’s still a pretty small & connected industry, so defaulters have nowhere to hide & ultimately have to pay up if they want to do business.]
Noting this working capital outflow has essentially been reversed since (see Q1/Q3-2015 above), it’s sensible to adjust accordingly – for example, if I substitute the adjusted operating margin of 7.6% for FY-2014, I re-calculate the average adjusted Op FCF margin to be 26.0%. This may seem like a bit of a fudge, but noting the various average margins I’ve already calculated above/previously, it’s entirely justified to assert Saga’s generated a 26% long term average adjusted margin, however you want to slice & dice it. Of course, it’s also worth highlighting the current (LTM) adjusted operating margin’s nearly identical at 25.1%.
In my book, that kind of margin continues to deserve a 3.0 Price/Sales multiple, based on my FY-2015 turnover estimate of EUR 57.4 million. And Saga’s LTM finance expense of EUR (2.0) million can be expected to decline with the recent/ongoing decline in receivables & debt – meanwhile, it stands at 13.5% of Saga’s LTM adjusted operating margin (of EUR 14.8 million), which remains within my usual zone of comfort. Therefore, I don’t see a need for any kind of Cash/Debt Adjustment here. Finally, Saga still has 0.9 million A shares & 2.7 million C shares outstanding (only the C shares are publicly traded), so now we arrive at:
EUR 57.4 M Turnover * 3.0 P/S = EUR 172.3 M / 3.6 M Shares = EUR 47.87 Fair Value per Share
Compared to the current share price of EUR 17.89, this fair value price target now offers an Upside Potential of 168%. And this is surely a good place to take a peek at the 5 year price chart…

Saga Furs tripled in little more than a year back in 2012/2103, and for the last two years the stock’s relentlessly given back that entire rally. Again, noting the consistent upward trajectory in auction sales & prices over the past year, plus the fact LTM sales remain almost 30% below their FY-2013 peak, I doubt the September auction result suddenly heralds a new & sustained decline in sales. But sentiment’s so sour, all good news & results in the past year have been comprehensively ignored, while the September news actually drove the shares lower by nearly 20%…
Forget buying falling knives, this is the scenario I patiently await. And it happens more often than you might reasonably expect – after a company’s fundamentals & share price collapse, the stock ends up being so neglected it severely lags (or even ignores) any eventual recovery. Again, it’s a great investment opportunity that can prove difficult to actually buy…though averaging in is a great way to suppress that ol’ fear & greed. [And if you can manage to average in/out of a number of your holdings, sequentially and/or simultaneously, I promise you’ll find yourself taking a far more detached & systematic approach to your portfolio. See here & here].
I have now increased my Saga Furs holding from 3.0% to 5.5% of my portfolio…and with the stock now trading for a mere 3.2 times peak earnings, I remain open to further increasing my holding.
- Saga Furs (SAGCV:FH): EUR 17.89
- Market Cap: EUR 64.4 Million
- Dividend Yield: 3.9%
- P/E: 6.4
- Price/Sales: 1.1
- Tgt Mkt Cap: EUR 172.3 Million
- Tgt P/E: 17.1
- Tgt Price/Sales: 3.0
- Tgt Fair Value: EUR 47.87
- Upside Potential: 168%

Pingback: Wexboy – Top 14 Tips for 2016! | Wexboy
Hi Wexboy,
Great finding, great analysis. Thank you for sharing this idea!
Thanks Roger – and if you have any Saga Furs related questions/comments, please feel free to share here or by email. Regards, Wexboy
Hi Wexboy,
thanks for the offer, perhaps I will use it later! Actually I have no draining questions, and I also do not suppose to have founds many things you do not already know.
But if you are interested, I made a personal write-up about saga furs (in German) in this forum, November 9th: http://www.stw-boerse.de/forum/messages/1719/3685.html
I write there as Al Sting, with a reference depot as well: http://www.stw-boerse.de/apps/depot.php3?DEPOT=al
Its part of a share-depot contest running since 2002, with me beeing quite a newby, entering only in 2010: http://www.stw-boerse.de/apps/depotvergleich.php3
Regards, Roger
Thanks Roger – noted.
Pingback: Some links | value and opportunity
EV/EBITDA is 10x. It is not undervalued really.
Thanks banjomano,
I checked your calculation…and I agree, EV/EBITDA would appear to be 10x (and presumably is reported as such on financial data services & screeners).
But as I’ve highlighted above (& in my previous post), the financial income Saga earns (interest & fees on buyer & breeder receivables) is an integral component of its business model & EBITDA. Therefore, I calculate Saga’s EV/EBITDA is just 6.2 times right now. And if debt normalises further, I suspect that ratio goes even lower (as EV shrinks).
So, the real challenge here isn’t valuation, it’s when & how it re-rates (for example) to a luxury goods multiple, which I think would be well-deserved in terms of Saga’s unique investment proposition & long term sales and margin record. My FV target implies a 16.7 EV/EBITDA multiple (based on today’s figures), which we’ve certainly seen before in the luxury goods sector. Fortunately, we’ve already seen Saga triple in the space of a year, so we know investors are prepared to significantly re-rate the stock if/when sentiment improves. And the fact Saga now trades on 3.2 times peak earnings is a great reminder of the potential upside if we see sales regain/surpass their previous FY-2013 peak in due course.
Regards,
Wexboy