
Tags
absolute return, annual review, Applegreen, benchmarking, blockchain, bubbles, cryptocurrencies, Donegal Investment Group, KR1 plc, portfolio performance, Rasmala, relative return, shareholder activism, Trump, Zamano
Back in much happier days (last July!), faced with indices that were (on average) broadly flat, I sagely accepted that:
‘Looking back, the first half this year seems kind of inevitable now…’
Of course, this now haunts me as absurd understatement. And an unfortunate reminder the hardest time to sell is…inevitably, when you should sell! But after a crackerjack 2017, I did see 2018 as more of a market time-out, than anything else – as reflected here, consciously or not, in the lack of blog posts & commentary. My bad…but sometimes it’s better to take stock & just enjoy how wonderful real life can be!
The same is true of my disclosed portfolio – my only reported activity was to: i) top up my Record (REC:LN) holding (which I still prefer to call bad timing, vs. an actual bad decision), and ii) re-establish my Donegal Investment Group (DQ7A:ID) portfolio allocation, after management redeemed over 50% of its outstanding shares. Elsewhere, after enjoying rapid/substantial price run-ups on certain undisclosed holdings (the main reason they never quite made it onto the blog), I focused on positioning myself for a rough October. Pals will back me up on that…but obviously it wasn’t visible here, it’s never enough when you’re right (cheap buys won’t offset damage in the rest of your portfolio), the market proved far worse than I expected, and only fools believe in all or nothing market timing anyway.
[Forget the guy who pissed you off the other day – you know the one, that dude boasting only an idiot wasn’t all in cash & set for the crash – because he’s also the guy forgets how many other times he (wrongly) went to cash, plus all the gains he’s missed out on over the years].
So let’s just go ahead & survey the actual market carnage – here’s my FY-2018 Benchmark Return – as usual, it’s a simple average of the four main indices covering most of my portfolio (& my readers’ too, I expect):
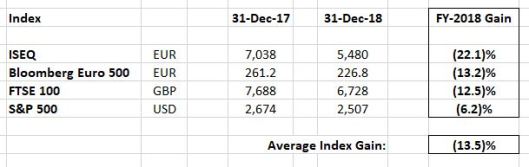
Ouch…a (13.5%) benchmark loss!
Wow, it’s literally an entire decade since we’ve seen an annual S&P loss (on a total return basis)! Which must be all the more galling for European investors to see it, despite a 6.2% decline, once again outperform their local indices by such a huge margin (here’s my FY-2017 Benchmark). Maybe it was inevitable, but Trump – as in his #TrumpBump (taxes) & #TrumpSlump (tariffs) – was obviously both the making & unmaking of the market last year. Unfortunately, overseas markets were only graced with the latter…again, galling.
Looking back, investors had already anticipated (& discounted) an eventual Trump tax package – an obvious driver of the S&P’s 19.4% gain in 2017 – so there was little reason to expect fresh buying last year on the actual headlines. But momentum matters – exuberant investors were playing with house money, so the S&P managed to overcome global reversals in both early-February & late-March/early-April, deliver a positive H1-2018 return, and only finally peak in September. [The Nasdaq & AIM All-Share Index also peaked just weeks prior to the S&P, after enjoying 25%+ returns in 2017]. In contrast, the bounce in European markets failed back in the latter half of May, with the indices in relentless decline for the remainder of the year.
However, the dollar did recover about half his prior year losses – benefiting from a tighter Fed policy & specific bouts of emerging market currency weakness – gaining 5% vs. sterling & the euro. So returns for well-diversified US & European investors were closer than the table above might suggest. Then again, when did you last meet an average US investor who actually owned overseas stocks?! Home bias is bliss. ‘Til it isn’t…difficult to believe now, but inevitably there’s a long hard road of relative under-performance ahead for US investors.
As for the FTSE’s 12.5% correction, it seems like perfect confirmation of the general idiocy & incompetence surrounding #Brexit. Fun to think,…but in all likelihood, any realistic Brexit scenario’s already discounted by investors, and the FTSE’s fall simply mirrors that of Europe. [Sure, the FTSE isn’t a great UK proxy…but when’s that ever stopped investors buying it?!] The AIM All-Share’s 18.2% decline may seem more of an indictment – but as above, I suspect it was actually tracing much the same trajectory of momentum & then risk aversion/revulsion as we saw in the US. In the end, it’s more instructive to look to the foreign exchange market: As I mentioned, Cable fell in tandem with EUR/$ on dollar strength…so despite all the hysterical headlines, sterling was only 1.2% weaker vs. the euro in 2018, a mere day’s worth of real FX volatility! And focusing on what traders/investors do (rather than say!), this level of sterling stability seems like a better gauge of underlying Brexit anxiety.
Of course, Europe delivered the usual in 2018, with the Bloomberg European 500 falling 13.2%. [Being a value investor may suck right now…but it sucks a hell of a lot more in Europe!] Banks are an obvious culprit…while US bank valuations are nothing to boast about, at least the US authorities have ensured they’re all well-capitalised. Clearly, the same isn’t true of Europe – despite an even more aggressive monetary policy (ultimately), it’s astonishing the ECB’s still failed to properly re-capitalise & renew confidence in the banking sector right across the board. Not that the sector itself is any help: It remains a punching bag for US regulators, Deutsche Bank feels like ‘Titanic II’, the Italian banks are simply pretending & extending, Greece is a black hole, while Danske Bank feels like just the starting whistle for a decade of money laundering revelations & prosecutions to come. [Kudos reserved only for the Irish & Spanish banks!] Then again, the notion Draghi may finally start tightening monetary policy/liquidity this summer seems pretty ludicrous now…so an accommodative policy will remain as a potentially helpful backdrop (albeit, to date, how helpful is debatable) for businesses, investors & consumers.
Then we have the ISEQ’s 22.1% collapse – not what I was anticipating! But again, I don’t actually see this reflecting any real Brexit anxiety, or the underlying economy (which is booming & again the fastest growing in the EU)! Instead, this performance – as alarming as it may seem – reflects the overall European market, European banks, disappointment with Irish property REITs’ performance, and other lingering (large) company-specific issues. Fortunately, I avoided the index malaise – as I always argue, Ireland’s a stock-pickers’ market – and was generally delighted with my own Irish portfolio exposure last year.
And I’m sanguine for the Irish market: I suspect such a bear market decline almost guarantees a positive return this year…and while Brexit may ratchet up market volatility, we’re at a point where fudges/grandfathering/transition clauses proliferate out of necessity, or else the whole sorry venture goes right back to the drawing board. And looking down the road, does it really matter in the end…I agree with Leavers the UK can forge its own way in the world, with an economy & trading relationships not much different than today, or most other countries. But that’s the tragedy here: The UK’s trading something for nothing, i.e. no discernible future/competitive advantage – apart from some deluded dream of past glories – noting its already unique EU status, where it enjoys all the inherent benefits AND its own independent currency & monetary policy.
But let me stop there…
Because I was planning on sticking to a basic post-mortem of 2018 here, and avoiding the risk of tainting my outlook for the coming year. [I hope/plan to focus on prospects for both my portfolio & individual holdings later this month instead]. So let’s move on – but first, let me provide a timely update on some portfolio sales (as of year-end), all of which are portfolio decisions rather than any fundamental change in my underlying investment theses, i.e. I’m re-sizing existing holdings & freeing up cash for new purchases:
Portfolio Sales
Alphabet (GOOGL:US): Reduce portfolio allocation from 11.5% to 10.8%.
Applegreen (APGN:ID): Reduce portfolio allocation from 8.4% to 6.0%.
Tetragon Financial Group (TFG:NA): Reduce allocation from 4.7% to 4.0%.
Plus I have two de-listings to report, which I’ll treat as portfolio exits as of year-end – reading my farewell commentaries below, it’s ironic to note both actually delivered (marginal) gains last year!
Portfolio Exits
Rasmala (RMA:LN): Basically inevitable at this point, but still a disappointing exit. In November, management proposed a cancellation vote (ignoring the potential Dubai-listing alternative they’d previously floated to shareholders), citing the lack of liquidity & the costs of being a listed AIM company. This was approved in December, with zero meaningful shareholder dissent, setting in motion a tender offer (that closes later this month) to mop up minority/private investors. This was priced at 150p per share, a mere 5% premium to the closing share price…which seems all the more cynical, when you note it’s a massive 62% discount to Rasmala’s 396p NAV per share! Not to mention, the tender’s only for 20% of the outstanding shares!? But presuming the main stakeholders choose NOT to participate, apparently it should be sufficient to accommodate all investors seeking an exit.
And if it’s not, I’ll be more than happy to share the CEO’s details & encourage shareholders to contact him regularly to discuss further…
This is the third & final Rasmala tender I’ll participate in* (at 250p, 150p & 150p) – referencing this letter, as an example, I’ll certainly take some credit for two of those tenders, Rasmala relinquishing its banking licence, along with some other operational/governance changes. But investor activism won’t necessarily change the underlying economics of a business…as I diagnosed in the same letter (& should have heeded), management couldn’t deliver a decent return on equity, even if it achieved its $3 billion AUM target. [Which never happened…] While I did break-even on Rasmala (& my portfolio allocation steadily declined) – see my initial write-up here & here (note a subsequent 1-for-50 consolidation) – it’s a painful reminder activism (& poor investments) are generally about extracting value, not compounding value. Which makes time your enemy – one that relentlessly seeks to dilute your returns & increase your opportunity cost…
[*Any issue with the tender, I can still rely on the 150p tender price (a 62% discount to NAV per share!) as an appropriate year-end mark-to-market.]
Zamano (ZMNO:ID): This sad & sorry adventure also comes to an end, with the company finally in liquidation. Alas, it comes at least a year after most shareholders would have originally anticipated it…probably better not to dwell on the incremental costs of that! Not only did the directors miss a number of self-imposed deadlines, they caught the usual Irish fever – yes, property – focusing exclusively on chasing a reverse-takeover deal (with Menolly Homes, as per the press) all the way to the end of the rainbow. I say ‘exclusively’, because I specifically introduced what might otherwise have proved a very suitable & viable alternative RTO candidate company. [And questioned the likely reception to another Irish property IPO…we all know what happened to the Irish REITs since]. Of course, there’s nothing at the end of the rainbow – in August, the directors announced ‘the Target has notified Zamano that it no longer wishes to complete the Potential Transaction’.
At that point, there was insufficient time to evaluate any other deal to re-activate/exploit Zamano’s listings (stock was suspended since March) – but still it took another 3 months for a liquidator to be appointed, in November. The company’s estimated net asset value of EUR 4.55 million (approx. 4.6 cents per share) appears conservative (see p. 6), with a distribution planned for later this month. [Accordingly, I’m relying on Zamano’s NAV per share as an appropriate year-end mark-to-market].
Nearly five years later, I’ve suffered a 46% loss on my original Zamano investment. Most unwelcome…but realistically, such losses are (occasionally) inevitable in any portfolio (even those rare portfolios blessed with no unforced errors). I did monitor/evaluate the risk of regulatory fines (which were surprisingly small & rare), but never expected the business to be destroyed almost overnight. Nor did I really expect the possible 20 cent offer to fail (or attract no other bidders) back in 2015, noting Zamano’s net cash/cash generation at the time. Which is the killer for me – in terms of opportunity cost – I could have sold out & doubled my money! But that’s hindsight for you – in a value/event-driven situation, it can prove incredibly difficult to sell out at a significant discount to (perceived) fair value (whether it’s NAV per share, a possible bid offer, or an intrinsic value estimate). As I stated here:
‘The real blame lies squarely with Zamano’s executive management – they failed to deliver a single acquisition, they failed to deliver on any new business/growth initiatives (like direct carrier billing), they had zero skin in the game to ensure a takeover offer actually made it over the finish line, they presided over the implosion of the company’s business, and then they ended up actually getting paid to walk away with the dregs!?’
In the end, the lesson to be (re-) learned here is the abiding need to evaluate, monitor, challenge, or simply avoid management…specifically, management teams with no meaningful skin in the game, because all too often their financial motivation & incentives can diverge radically from shareholders.
Now, time to zoom back out to my overall portfolio…
Portfolio Performance:
Here’s the Wexboy FY-2018 Portfolio Performance, in terms of individual winners & losers:
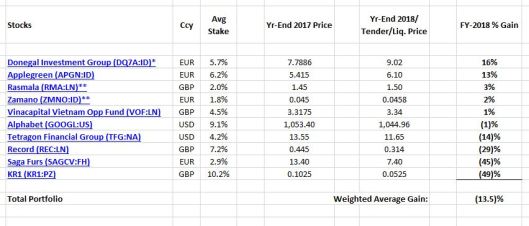
[**Exits: RMA:LN at 150p per share tender offer price, ZMNO:ID at 4.58 ct NAV per share. *Redemption: DQ7A:ID year-end price of €8.75 adjusted to reflect redemption of 53.7% of o/s shares at €9.25 per share in May (position subsequently rebuilt, essentially at break-even). Otherwise: Gains are based on average stake size & year-end prices.]
[NB: ALL dividends & FX gains/losses are excluded.]
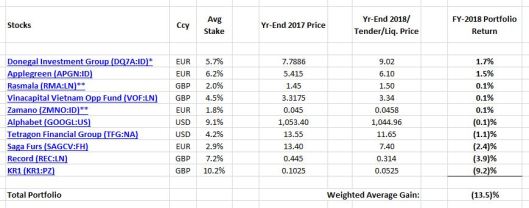
And ranked by size of individual portfolio holdings:
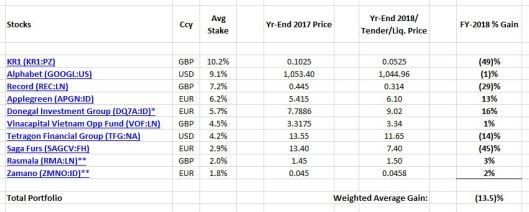
And again, merging the two together – in terms of individual portfolio return:
Yup, behold the damage…
Turns out, actually matching my benchmark return – down to the decimal point – is no consolation when it means a (13.5)% portfolio loss in a terrible year, and my worst absolute return over the last seven years of the blog.
But fortunately, there’s a bit of a silver lining…
In 2017, I enjoyed a real barnstormer, in terms of both my relative & absolute return – i.e. my +26.3% portfolio gain was two & half times my +10.7% benchmark return. But I did admit I’d been blessed with a little crypto pixie dust – my KR1 (KR1:PZ) holding rocketed almost 150% in the last 3 months of the year (in fact, more than doubled in the wake of my original Sep-2017 write-up). My ex-KR1 performance would have been a +15.0% gain…a much lower absolute return, but still impressive vs. my benchmark.
This year – in a ghastly example of mean-reversion – pretty much the opposite is true. My FY-2018 ex-KR1 performance would have been a (5.2)% loss…an impressive +8.3% out-performance vs. my benchmark, but still a loss in absolute terms. I should have titled this post:
‘FY-2018: What The Crypto Gods Giveth, They Also Taketh Away…’
Maybe I shouldn’t complain: While my crypto-related losses in 2018 are still (painfully) real – though notably exaggerated, as KR1’s effectively a much larger 19% position in terms of my actual disclosed portfolio – they’re mostly a wash in terms of FY-2017/2018 (& my relative FY-2017/2018 performance is good). I guess it sums up last year’s crypto-lunacy…to somehow feel disappointed with KR1 for delivering, in the end, a mere 27% gain over the last 15 months!?
Again, the killer’s the coulda/woulda/shoulda lament in my head – I’m sure you know it too – why on earth didn’t I trim/sell-out of KR1 when crypto went crazy ’round the start of last year?! But that’s the insidious nature of bubbles…at the time, I could actually persuade myself to believe KR1 was under-valued, despite its soaring share price! After all, if crypto trading sardines traded at ridiculous multiples of book, shouldn’t KR1 too? But as I stated upfront, I had no desire to trade or even have a specific view on actual Bitcoin/crypto prices – I was focused on making a long-term blockchain bet. So while avoiding a trader’s mentality saved me from indulging in bubble madness* – traders love to exploit the greater fool, who starts madly buying right at the top – clearly, it also blunted my ability to escape from said bubble.
[*Fortunately, with no fundamental support, I saw no reason to participate in the recent former cannabis bubble!]
In the end, I’m still happy with my fundamental investment thesis: Globally, KR1 remains a truly unique listed investment vehicle…one that offers investors a diversified early-stage crypto/blockchain portfolio. Just to add valuable perspective, here’s my original core crypto/blockchain sector table, now updated to 31-Dec-2018:
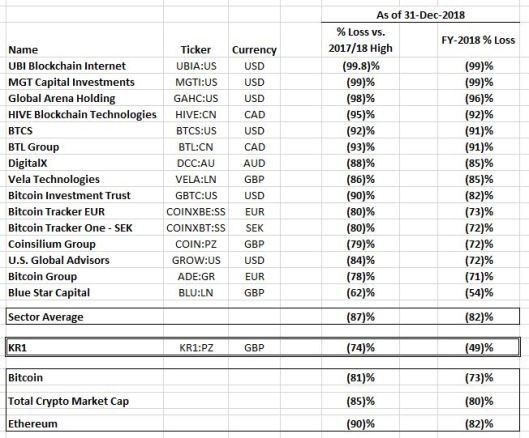
Yup, despite some pretty grim losses, KR1 can actually boast it was still the best-performing crypto-asset on the planet last year! Sooner or later, let’s hope that proves a good omen for the next crypto rally…
Happy New Year!

Looks like we get to exit Rasmala after all with the tender undersubscribed.
http://rasmala.com/2019/02/results-of-the-tender-offer/
Aye, aye…this was my subtle hint!
‘But presuming the main stakeholders choose NOT to participate, apparently it should be sufficient to accommodate all investors seeking an exit.’
Thanks for the insightful post as usual. When are you going to update on prospects for your portfolio/individual holdings? Soon I hope 🙂 … interested to know the rationale behind trimming APGN seeing as you previously estimated that it could have quite significant upside from where SP was at and is still more or less at.
Hi Elliott,
Sorry for missing this…
I want to focus on/return to portfolio allocation first, but I will be revisiting individual holdings in due course.
As per above, the reduction in my Applegreen stake (from 8.4% to 6.0%) was a genuine portfolio allocation/risk management decision, rather than some kind of reflection on my (unchanged) investment thesis. Its good absolute/relative portfolio return to date was an opportunity to free up cash for other potential buys – essentially, I’ve just reverted to my original portfolio allocation, which was 6.2% here in May-2017:
See my pre-results Twitter thread here, from yesterday:
And of course, Applegreen’s actual FY-2018 results & presentation today:
Click to access 2018-preliminary-statement-of-results.pdf
Click to access 2018-preliminary-results-presentation.pdf
Best of luck,
Wexboy
In this market downturn, we kept positive by focusing on the defensive, particularly in Australia. Even in the GFC there were a handful of stocks that actually went UP – eg. Walmart, H&R Block. Some businesses are cockroaches. A wise investor knows what to buy for all seasons.
Too true, Simon.
And bigger picture, it seems to me that (developed market) government & consumer finances/balance sheets/prospects are becoming ever more fragile over the years, so the over-arching strategy in my portfolio has been to gradually migrate (in the last couple of years, price permitting) towards high quality secular growth stocks which I believe can grow & deliver regardless!
Pingback: Seeking Returns
Any news on when suffering Zamano investors will finally receive their distribution?
Hope you received your Zamano distribution cheque since:
If not, give me a shout & I can help.
Note there will be another distribution to come.
“when did you last meet an average US investor who actually owned overseas stocks?!”
Nice to meet you – my top 2018 dividend countries were Canada 10.18%, UK 2.31%, Singapore 1.64% and Australia 1.44% (12 total non-US). Maybe I’m abnormal! My guess is as long as the US economy can outrun the growing deficit we’ll delay the inevitable under-performance.
That US out-performance is already a decade old now…
Keep in mind the US market managed to outperform for nearly two decades twice in the 20th Centur (post WW2 to mid 1960’s and 1982-2000)
Yes, somewhat astonishingly, US out-performance tends to run in 8-20 year streaks. And we’re currently around the decade-long mark…so yeah, who knows how much longer this latest streak may continue!?
But given the level of investor neglect/aversion/disgust we’re seeing re Europe* now (and esp. versus the US) – totally logical in so many ways – my lizard brain can’t help but wonder if ALL the bad news (well, RELATIVE to the US) is actually/finally discounted, so you just gotta close your eyes & click the buy button at what may ultimately prove the point of maximum pessimism…
*I’m particularly fascinated at what seems like an almost universal presumption (/capitulation) that European banks are now condemned to trade at a significant discount to book forever!?
Like it or not, I anticipate Tobacvo indudtry among the brst 2019 Performers: was knocked in 2018 (unexpensive), and it sells convenience products (crisis-proof). Actually Altria-PhilipMorris were among the most resilient blue chips during 2007 FinCrisis.
For convenience products, I prefer chocolate and toiletries industry. Anyone out there with a good chocolate value?
Plenty of chocolate out there (one of the best affordable luxuries I can think of)…the challenge is finding the value!?
Well, the tobacco stocks generally had quite the knock-back in 2018, so a strong sector performance in 2019 wouldn’t be all that surprising…
…unfortunately, you now also need to be an expert on vaping (& weed), and try handicap their respective legislation/regulatory risks & progress!?
“but inevitably there’s a long hard road of relative under-performance ahead for US investors”
Why, because the US stocks have outperformed European stocks and it’s only fair if that reverses?
Yes! Be afraid, very very afraid…